Bridging consumer behavior and data analytics: How transactional market basket analysis transforms routine grocery trips into targeted retention strategies.
Why This Project
I’ve always been fascinated by how everyday consumer touch points, like opening an app and seeing a custom coupon for items you actually buy, shape customer loyalty.
For this project, I set out to investigate the behavioral mechanics of retail personalization.
I sought to measure how data-driven cross-sell recommendations drive customer retention, basket expansion, and regional merchandising efficiency.
Dataset
To model this, I created a synthetic relational grocery dataset containing 500 transaction rows across four store locations (Portland, Bangor, Augusta, and Lewiston).
The dataset features timestamps, product categories, and intentional co-occurrence purchasing patterns.
Core Takeaways
1. Regional Store Performance & Inventory Merchandising
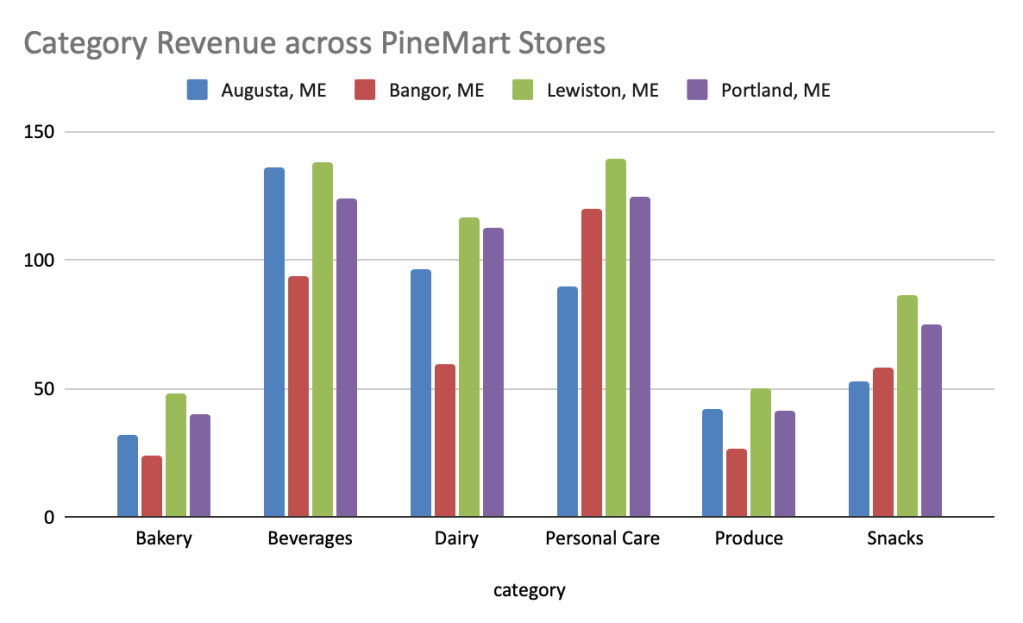
By analyzing category revenue across store locations, clear regional trends emerged:
- Beverages and Personal Care dominate revenue across all four locations, particularly in Lewiston and Portland.
- Recommendation: Prioritize end-cap displays and high-visibility promotional banners for Beverages and Personal Care in high-volume stores to maximize impulse buys and basket value.
2. Customer Segmentation & CX Strategy
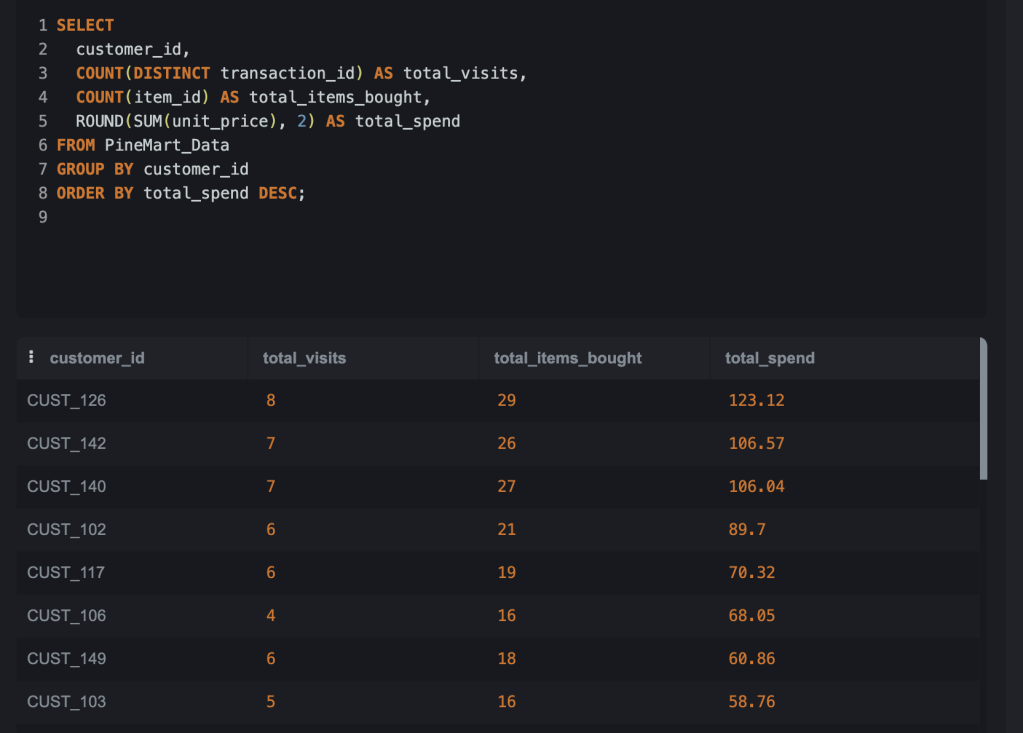
Using SQL aggregation, I analyzed customer-level spending to identify top-tier visiting patterns.
SELECTcustomer_id,COUNT(DISTINCT transaction_id) AS total_visits,COUNT(item_id) AS total_items_bought,ROUND(SUM(unit_price), 2) as total_spendFROM transactions_dataGROUP BY customer_idORDER BY total_spend DESC;
The Insight: High-value spenders like CUST_126, CUST_140, and CUST_142 consistently drive the highest basket totals and visit frequencies.
CX Strategy: In a Customer Experience role, identifying top-tier segments (the top 5–10% of spenders) allows us to move away from generic marketing and deploy targeted retention strategies:
- VIP Loyalty Perks: Offer exclusive incentives (such as bonus discounts or personalized coupons) to prevent churn.
- Basket Expansion: Recommend higher-margin premium items tailored to their established purchasing habits.
3. Basket Affinity & Cross-Sell Optimization
To uncover which items are frequently bought together, I used AI to construct a self-join SQL query with Common Table Expressions (CTEs) to calculate item pairing frequencies and support percentages.
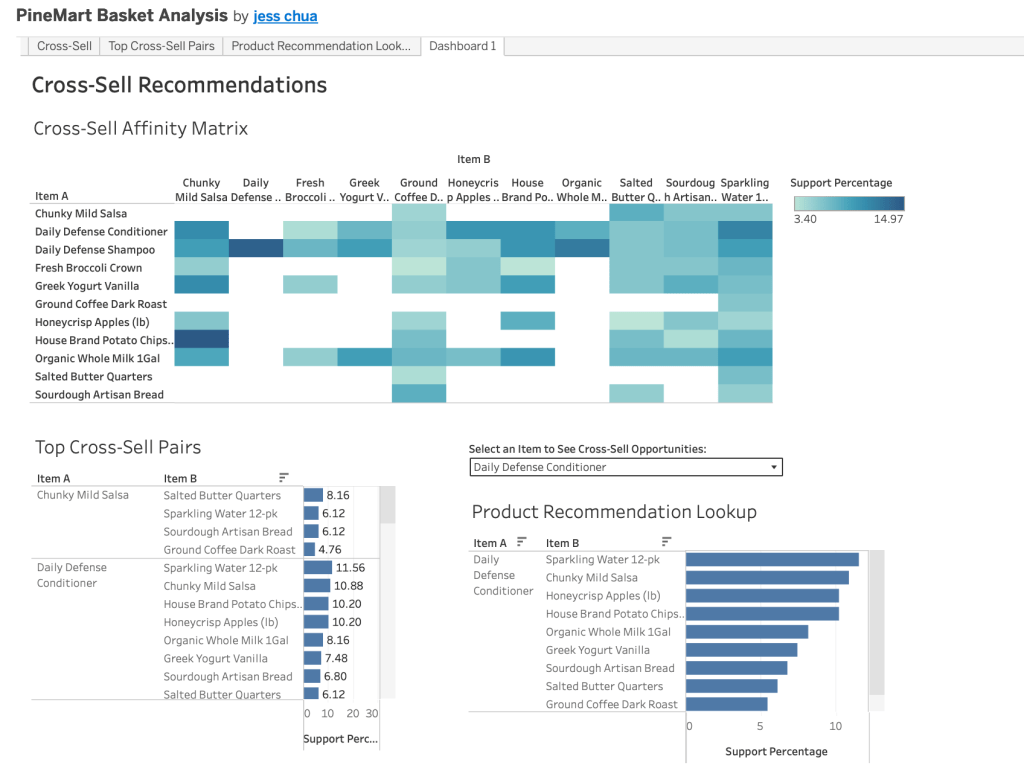
Key Finding: The highest-performing affinity pair was House Brand Potato Chips and Chunky Mild Salsa, appearing together in 14.97% of transactions. Additionally, Daily Defense Shampoo and Conditioner showed a strong 14.29% pairing rate.
Marketing & Merchandising Application: A ~15% basket attachment rate is a good threshold for cross-merchandising. Recommendations include placing temporary salsa displays directly in the chips aisle, or generating digital app coupons for salsa whenever a customer purchases potato chips.
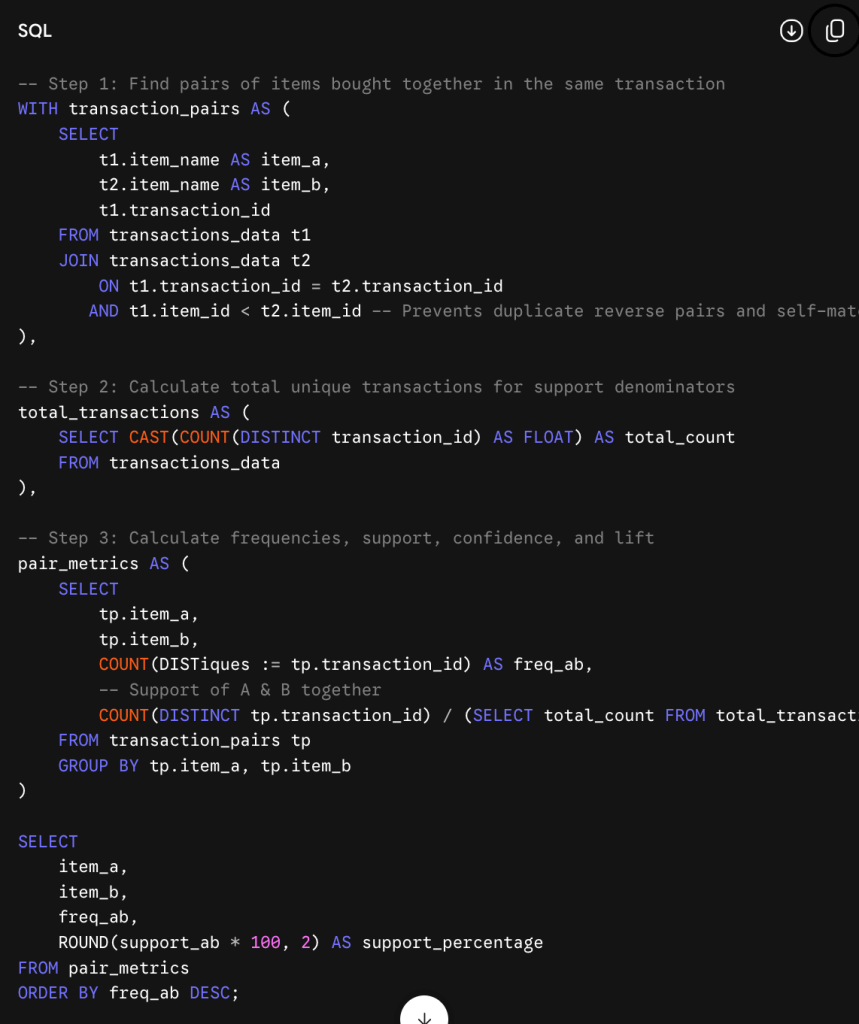
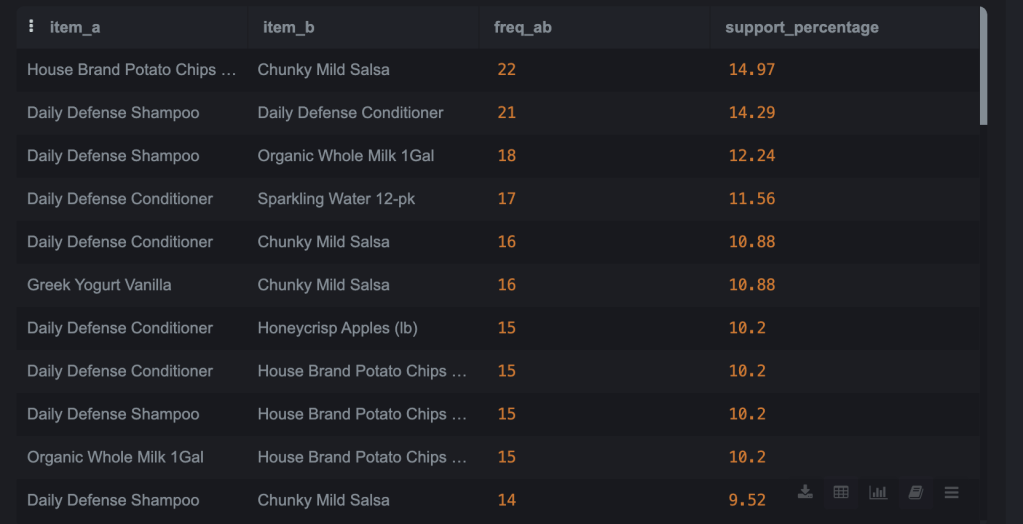
Tableau Interactive Dashboard
To bring these insights together, I built an interactive Tableau dashboard allowing stakeholders to filter cross-sell opportunities and inspect product recommendation lookups dynamically.