Project Overview

This project analyzes retail sales performance across multiple regions, product categories, and store types.
Using Excel, PostgreSQL, and Tableau, I built a complete BI workflow to uncover trends, identify inefficiencies, and generate actionable insights for business decision‑making.
Part of my IBM: BI Analysis final project.
Dataset: Modified subset of the Kaggle Retail Sales dataset (cleaned to fit Excel/Tableau limits).
Objective: Understand how store location, product hierarchy, and promotions influence sales.
Tools & Techniques
- Excel: Data cleaning, validation, pivot tables, regression
- PostgreSQL: Joins, aggregations, data cubes, ROLLUP
- Tableau: Dashboards, regional analysis, product insights
1. Data Cleaning & Preparation (Excel)
I cleaned and standardized 450k+ rows of sales data:
- Removed duplicates and whitespace
- Standardized inconsistent date formats
- Validated product, store, and city IDs
- Combined sales, stock, and pricing data for analysis
Exploratory Pivot Tables
I built three pivot tables to understand baseline performance:
- Sales by Store: Identified high‑ and low‑performing locations
- Sales by City: Highlighted regional differences
- Product Performance: Flagged high‑potential and low‑demand products
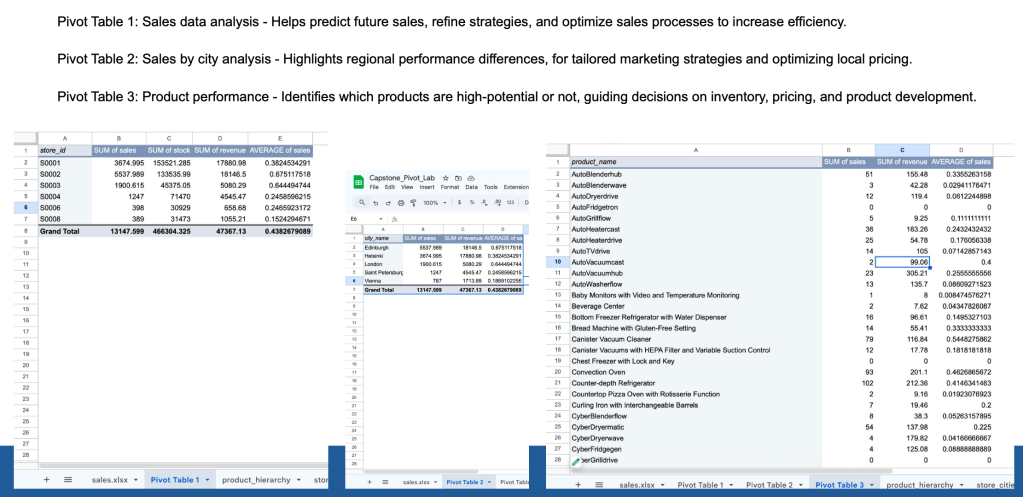
These tables guided the SQL analysis by revealing where deeper investigation was needed.
2. SQL Querying & Aggregation (PostgreSQL)
I loaded the cleaned dataset into PostgreSQL to perform structured analysis.
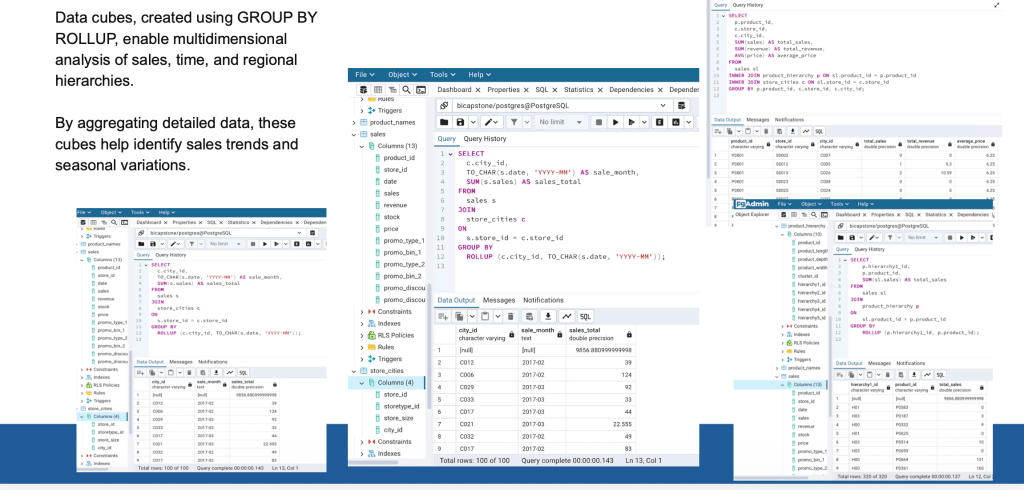
Key SQL Workflows
- Joined sales, product hierarchy, and city tables
- Aggregated sales by store and month
- Calculated total revenue and average price
- Built data cubes using
GROUP BY ROLLUPto analyze:- city → month → total sales
- product → store → revenue patterns
Example Insight
ROLLUP revealed seasonal fluctuations in several cities, with noticeable dips in March and spikes in February.
3. Statistical Analysis (Excel)
I ran a simple regression to explore the relationship between:
- Date
- Sales volume
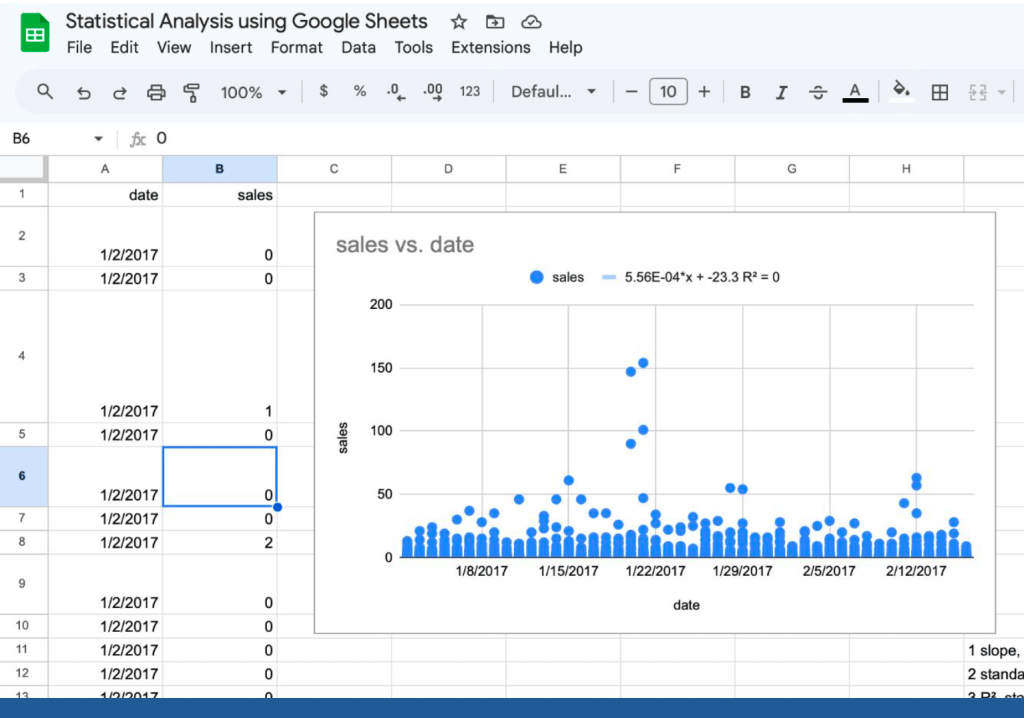
This helped identify early seasonal patterns and informed the Tableau dashboard design.
4. Tableau Dashboards
I created interactive dashboards to visualize:
- Regional sales performance
- Product category trends
- Store‑level efficiency
- Revenue vs. stock levels
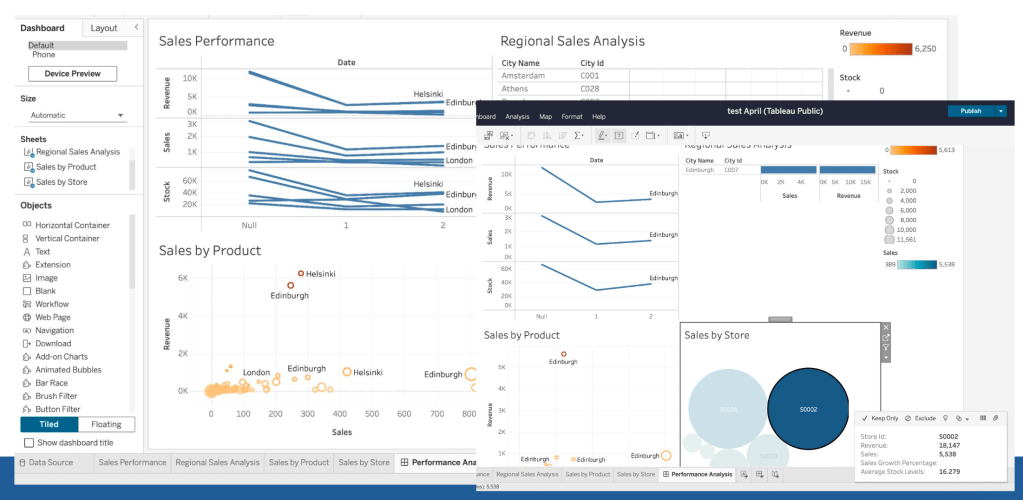
These dashboards allow stakeholders to quickly compare cities, drill into product categories, and identify operational bottlenecks.
Key Insights
- Edinburgh and Helsinki consistently outperformed other cities
- Several products showed high stock but low sales, indicating inventory inefficiency
- Product categories like Counter‑depth Refrigerators and Convection Ovens were strong performers
- Seasonal patterns emerged when aggregating sales by month
- Promotions had uneven impact, with some promo types showing no measurable lift
What I Would Do Next
If this were a real business environment, next steps would include:
- Forecasting sales using time‑series models
- Building automated dashboards
- Adding customer segmentation
- Conducting price elasticity analysis

