Data cleaning, spatial data prep, and resource mapping in volunteer / personal projects
I use structured analysis, SQL, and BI tools to:
- clean data and study patterns
- turn information into clear, actionable insights

Projects —
- Driving Safety
- MOCA Data Cleaning
- Support. Don’t Punish. (MyMaps)
1. Driving Infrastructure: Friction Mapping & Route Optimization

Category: Human-Centered CX Analytics | Community Impact & Urban Mobility
Tools: SQLite / SQL Analytics, Google Maps, Excel Pivot Tables, Tableau
Summary: Standard navigation algorithms (e.g., Google Maps, Waze) optimize almost exclusively for minimal travel time and shortest distance.
However, for returning, new, anxious, elderly, or mobility-cautious drivers transitioning across different road environments, the fastest route often introduces disproportionate cognitive load due to high-risk infrastructure friction (unprotected left turns, complex multi-lane merges, faded road markings, and high-accident corridors).
This project evaluates 21 route corridor variations in Bangor, Maine to map infrastructure friction points against travel efficiency, quantifying how minor trade-offs in time (+1 to +6 minutes) yield up to a 60% reduction in driving stress while improving driver safety confidence.
2. MOCA Data Cleaning
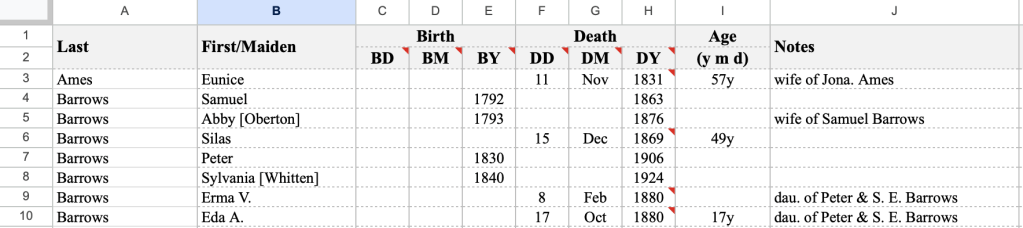
Maine Old Cemetery Association (MOCA) Data Cleaning
Summary: This project to organize cemetery records shows my approach via structured logic and AI‑assisted pattern extraction.
Tools: MS Excel / Google Sheets · Copilot AI
Skills: Data Cleaning · Text to Columns · Pattern Recognition
Project Link: MOCA (Cemetery Records)
Overview
I helped transform a complex, formula‑heavy cemetery‑records workflow into a clear, repeatable, volunteer‑friendly data‑cleaning system.
What I Did
- Data Cleaning Workflow: Broke down a multi‑page instructional sheet into a step‑by‑step, beginner‑friendly cleaning pipeline, removing unnecessary complexity while preserving MOCA’s required formatting rules.
- AI‑Assisted Pattern Extraction: Used AI to interpret and rewrite the “Notes” column, turning inconsistent transcriptions into clean, MOCA‑compliant phrasing. This eliminated hours of manual rewriting and reduced error rates.
Impact
- Reduced a multi‑hour manual cleaning process to a streamlined, repeatable workflow.
- Made the system accessible to non‑technical volunteers, increasing MOCA’s capacity to process historical records.
- Created documentation that can be reused for future cemetery projects, ensuring long‑term sustainability.
- Demonstrated practical BI skills in:
- data cleaning, workflow design, UX thinking, and AI‑collaboration.
3. Support. Don’t Punish. (MyMaps)

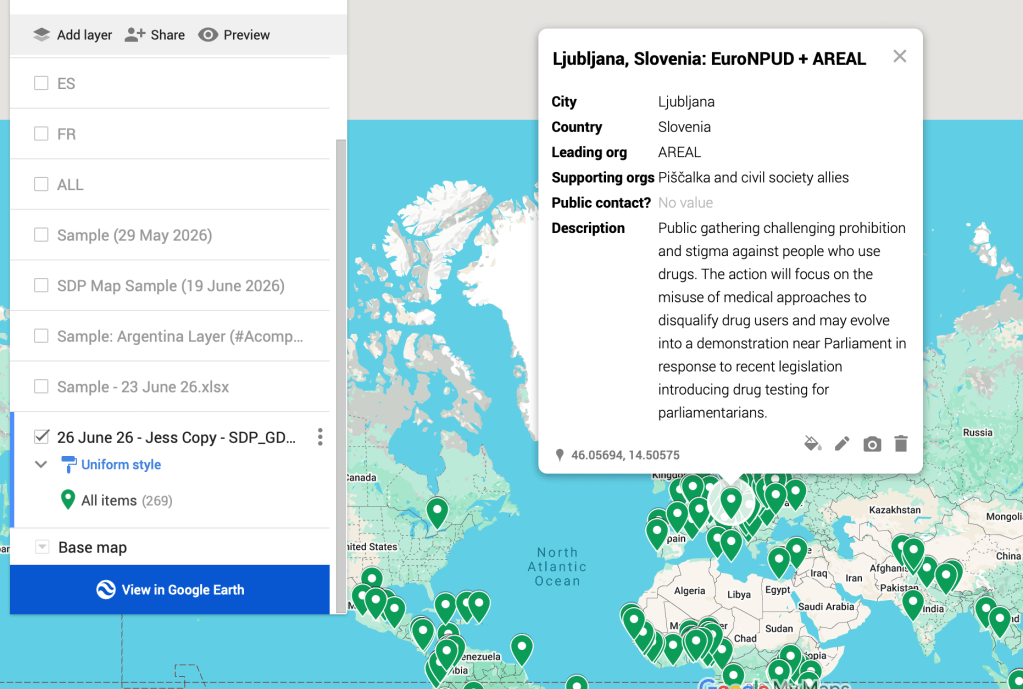
Summary: Support. Don’t Punish. is a global advocacy campaign calling for better drug policies that prioritize public health and human rights.
I cleaned and consolidated a 150+ row multilingual dataset for GIS import into Google MyMaps.
Tools: Excel, Pivot Table, XLOOKUP, TRIM function
Project Link: Support. Don’t Punish.
Skills:
My workflow included—
- batched processing
- breaking up combined city event rows into individual rows, via the TRIM function
- ambiguity reduction
- structural normalization
This included cleaning and standardizing a 47‑city Argentina dataset for MyMaps, fixing geolocation errors and inconsistent multilingual descriptions.
I reorganized and selected final columns for clarity and suggested a concise summary field to improve future scalability.
This improved data quality, UX, and reduced manual cleanup time.
The final dataset is clean, consistent, and import‑ready, with an estimated error rate under 2%.

