Personal / analytics projects demonstrating data cleaning, SQL joins, and Tableau visualizations
I use data visualization to clarify patterns and turn complex information into intuitive visual stories.
I’ve worked on a number of mapping and visualization projects to strengthen skills in:
- data collection and cleaning
- normalization
- spatial analysis
Projects —
- Retail Market Basket & Affinity (Retail Personalization)
- Maine Trail CX & Utilization (User Sentiment | Experience Metrics)
- IBM BI Full-Stack Capstone (PostgreSQL | Excel | Tableau)
- Chicago Public Safety Queries (SQL)
1. Retail Basket Affinity
Retail Affinity Analytics: Market Basket Optimization & Customer Segmentation
Category: Retail Personalization & Basket Intelligence
Tools: SQLite / SQL CTEs, Excel Pivot Tables, Tableau
Summary: Understanding how routine transactional data translates into tailored personalization is critical for balancing retention with commercial value.
This project models a synthetic relational dataset of 500 grocery transactions across four PineMart store locations in Maine, utilizing advanced SQL self-joins and Common Table Expressions (CTEs) to calculate product pairing support percentages (such as identifying a 14.97% attachment rate between potato chips and salsa).
The analysis bridges technical data modeling with actionable CX strategies, to optimize both store merchandising and customer loyalty.
2. Maine Hiking Log
Maine Trail Experience: Friction Mapping & Effort-to-Reward Analysis
Category: Human-Centered CX Analytics | Behavioral Segmentation & Retention
Tools: SQLite / SQL Analytics, Excel Pivot Tables, Tableau
Summary: Standard outdoor trail directories primarily categorize hikes by basic physical metrics—such as distance, elevation gain, and general difficulty.
However, from a user experience perspective, these surface-level specs fail to capture the behavioral trade-offs and operational friction points (remote travel distance, safety concerns, monotonous terrain, or underwhelming views) that actually drive user satisfaction and repeat intent.
This project evaluates 28 distinct hiking experiences across Maine to map environmental and logistical friction against aesthetic payoff, quantifying how specific pain points impact retention while isolating “high-efficiency delighters” that deliver maximum scenic reward with minimal physical cost.
3. IBM BI Full-Stack Capstone
Summary: This project analyzes retail sales performance across multiple regions and product categories. I built a complete BI workflow to uncover trends, identify inefficiencies, and generate actionable insights.
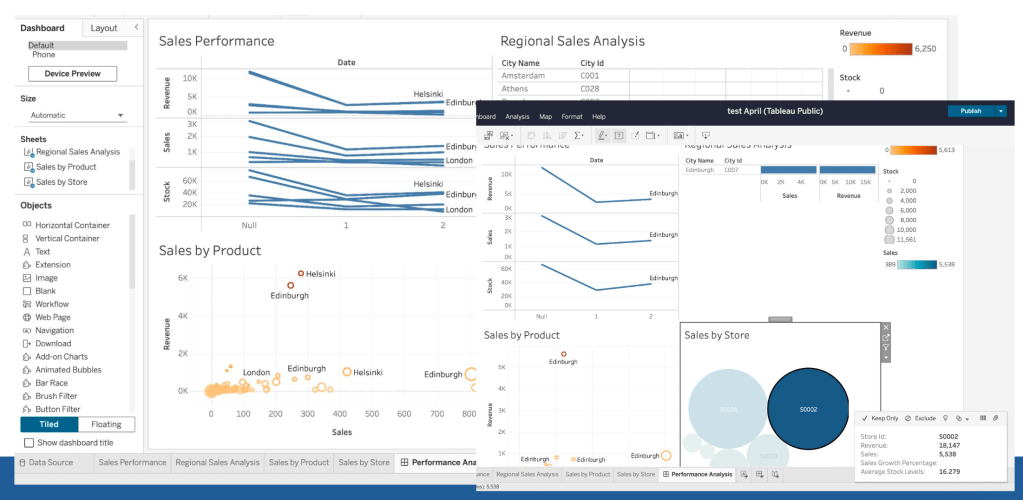
Tools: Excel/Sheets, PostgreSQL, Tableau
Skills: Data cleaning, statistical analysis (Excel), dashboard design
Link: IBM: BI Analysis final project
4. Chicago Crime Dataset
Summary: As part of my IBM: BI coursework, I used the Chicago Public Schools dataset to explore Chicago crime data.
It demonstrates my ability to query structured datasets, identify patterns, and translate raw data into insights.
Queried tables include CHICAGO_PUBLIC_SCHOOLS, CENSUS_DATA, and CHICAGO_CRIME_DATA.
a. Query showing the average school’s safety score:
SELECT AVG(Safety_Score) FROM 'chicago_public_schools';
b. Query for which types of crimes have been recorded at gas station locations:
SELECT DISTINCT PRIMARY_TYPE FROM 'chicago_crime'WHERE LOCATION_DESCRIPTION = 'GAS STATION';
c. Query using crime count GROUP BY:
SELECT ce.community_area_name, COUNT(*) AS theft_countFROM CHICAGO_CRIME_DATA crJOIN CENSUS_DATA ce ON cr.community_area_number = ce.community_area_numberWHERE cr.primary_type = 'THEFT'GROUP BY ce.community_area_nameORDER BY theft_count DESC;
d. Query joining CHICAGO_CRIME_DATA and CENSUS_DATA to look at theft incidents alongside the poverty levels of their respective neighborhoods:
SELECT cr.primary_type, ce.community_area_name, ce.percent_households_below_povertyFROM CHICAGO_CRIME_DATA crJOIN CENSUS_DATA ce ON cr.community_area_number = ce.community_area_numberWHERE cr.primary_type = 'THEFT'ORDER BY ce.percent_households_below_poverty DESCLIMIT 10;

