Analyzing 25 years of content (Mini BI Project)
A 20‑row dataset transformed into insights using pivot tables and simple visualizations.
Summary
This project analyzes 25 years of Dragonsinn content using data cleaning, pivot tables, and simple data visualization.
The goal was to create a small but meaningful BI artifact using a dataset I know thoroughly, allowing me to practice analytical workflows in a grounded, familiar context.
Dataset
I manually curated a 20‑row dataset containing:
- 5 poems
- 5 blog posts
- 5 site pages
- 5 mythic milestones
Each entry includes metadata such as year, era, motif/theme, tone, and adjusted word count.
Process
- Cleaned and standardized metadata
- Built three pivot tables
- Created three visualizations (bar, column, donut)
- Interpreted patterns across eras, content types, and motifs
Key Insights
- Creative output peaks in the “Past Quarter Century” era
- Content types evolve with web eras (poems + blog posts dominate modern years)
- Dragonsinn shows long‑term thematic consistency across decades
Tools Used
Google Sheets (data cleaning, pivot tables, charts)
Skills
- data cleaning
- pivot table fluency
- visualization fundamentals
- analytical storytelling
Spreadsheet, Tables, and Charts
I created the dataset in Google Sheets.
Here’s a cleaned version.
Insights
A. Content Evolution by Era
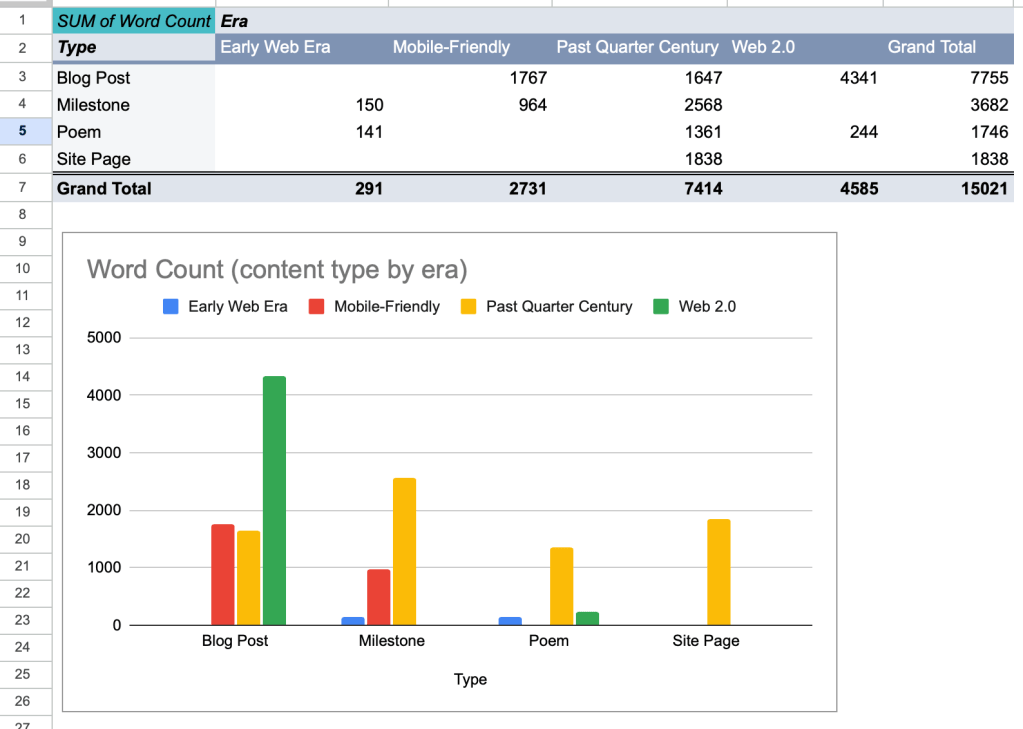
The first pivot table shows:
- Past Quarter Century is my most prolific era (in terms of word count), reflecting Dragonsinn’s revival and expansion.
- Web 2.0 was categorized by slow and steady, structured blogging output.
- Early Web Era has fewer items but represents foundational content.
Insight: My creative output follows long cycles — early foundational work, a mid‑era restructuring, and a modern resurgence.
B. Content Type Distribution
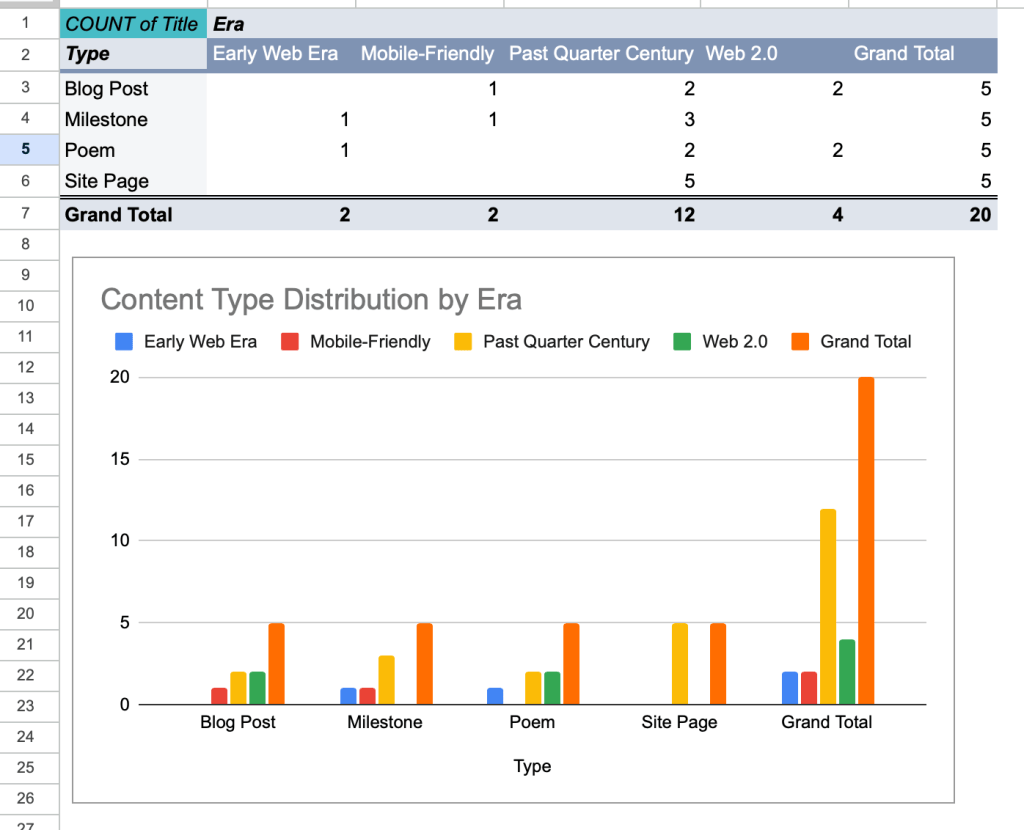
The second pivot table reveals:
- Each content type (Blog Post, Milestone, Poem, Site Page) appears exactly 5 times, creating a balanced dataset.
- But their distribution across eras differs:
- Blog posts cluster in modern eras
- Site pages and milestones cluster in Past Quarter Century
- New poems were absent during Mobile-Friendly era
Insight: My content types evolve with the web itself. Blog posts were absent in the Early Web Era, while milestones reflect the site’s longevity.
C. Motif / Theme Frequency
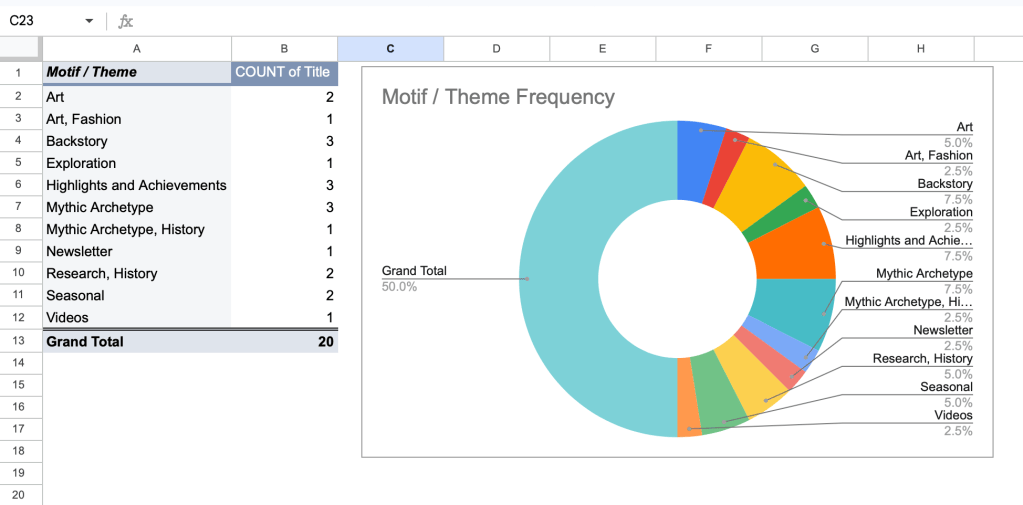
The third pivot table shows:
- Strong clusters around Backstory, Highlights & Achievements, and Mythic Archetype.
- Secondary motifs include Art, Seasonal, and Research/History.
- Rare motifs (Videos, Exploration, Newsletter) add texture without dominating.
Insight: My mythic voice explores archetypes, personal evolution, and creative milestones. This gives Dragonsinn a coherent thematic identity across decades.
What I Learned
- How to structure a dataset
- How pivot tables reveal patterns
- How to choose simple, effective charts
- How to narrate insights clearly
Closing
This compact projects demonstrates:
- data cleaning
- pivot table fluency
- visualization fundamentals
- analytical storytelling
- foundational knowledge for tools like SQL + Power BI

