Driving Logs & Safety Analytics
Why This Project
After moving from a remote rural small town to a small city, I realized I had a lot of bad habits that wouldn’t be considered as safe driving.
I also spent a lot of time studying Google Maps to try routes that would be more manageable for my nervous system and current skill level.
This project is fundamentally about risk mitigation, personal safety, operational efficiency, and behavioral habit tracking.
Dataset
I created the dataset manually.
Core Takeaways
1. Alternative Routes Significantly Reduce Stress
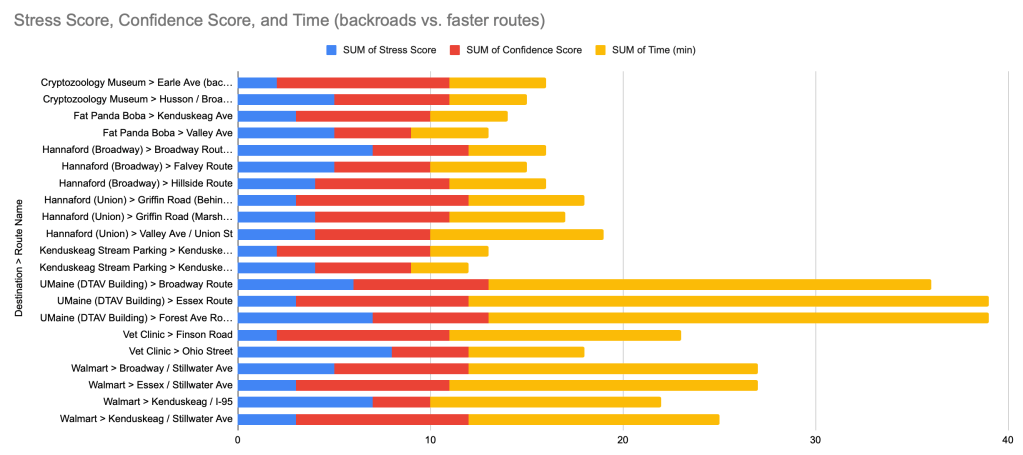
Taking alternative or backroad routes yields a substantial reduction in driver stress with minimal added travel time.
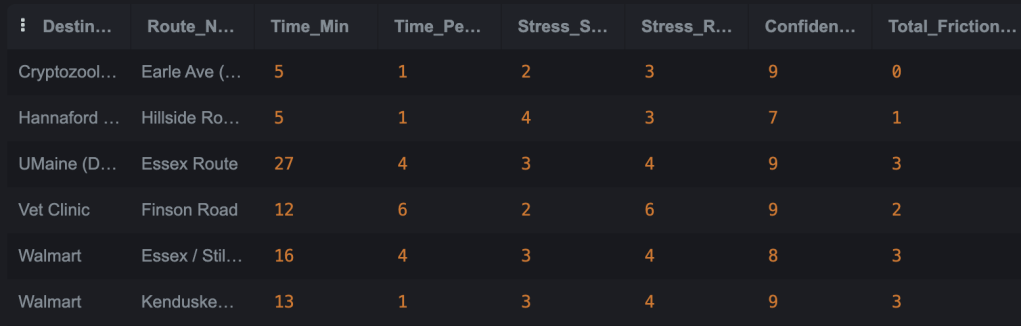
For example, traveling to the Vet Clinic via Ohio Street yields a high Stress Score of 8 and a low Confidence Score of 4 due to crash history and unclear lane splitting. Switching to Finson Road drops the Stress Score to 2 while boosting Confidence to 9.
Similarly, accessing Walmart via Kenduskeag / Stillwater Ave (Stress Score: 3, Confidence: 9) is far less stressful than taking Kenduskeag / I-95 (Stress Score: 7, Confidence: 3).
2. High-Risk Infrastructure Correlation
High-risk areas (such as complex intersections, heavy traffic corridors, and unclear signage) strongly correlate with higher stress scores and lower driver confidence.
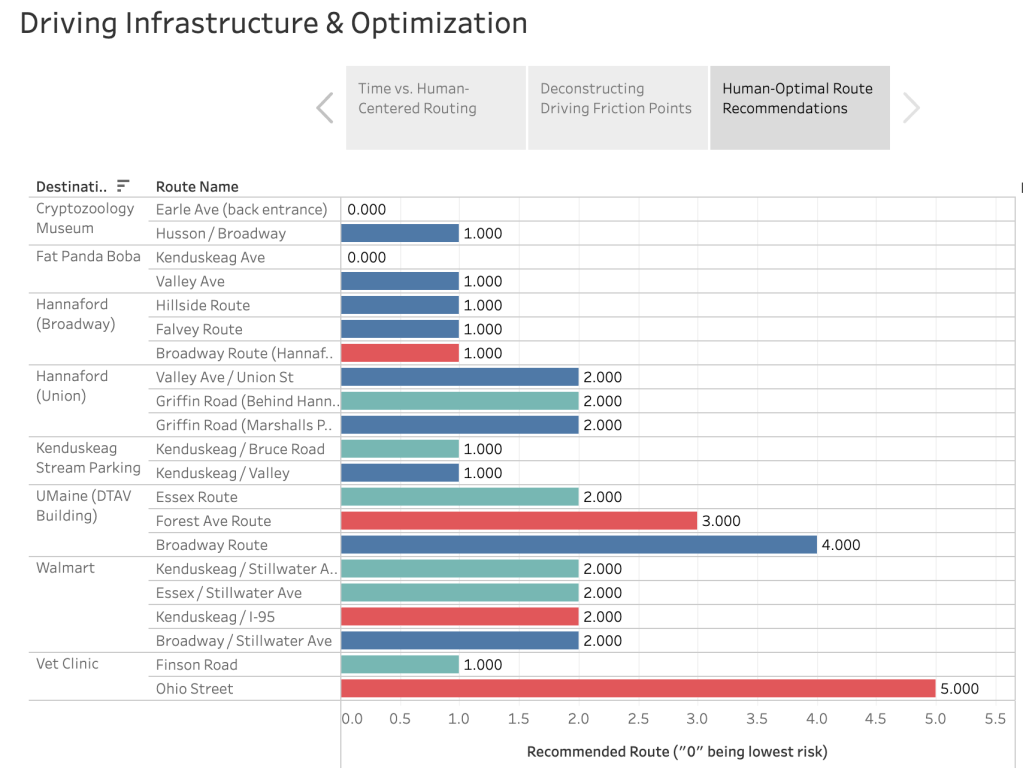
High-risk corridors include Ohio Street, Broadway Route (Hannaford exit), Forest Ave Route, and Kenduskeag / I-95.
3. Destination-Level Confidence vs. Stress Profile
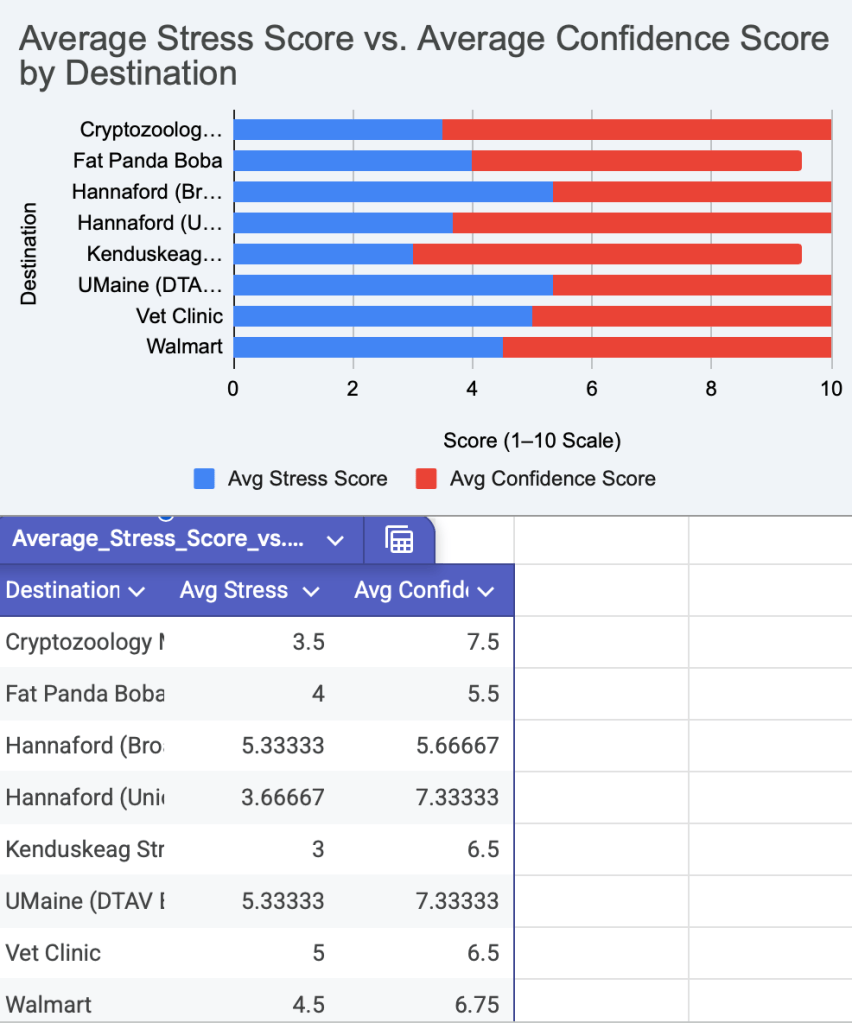
Across overall destinations, Cryptozoology Museum (Avg Stress: 3.50, Avg Confidence: 7.50) and Hannaford (Union) (Avg Stress: 3.67, Avg Confidence: 7.33) have the most favorable driver experience.
Hannaford (Broadway) presents the highest relative average driver stress (Avg Stress: 5.33, Avg Confidence: 5.67).
Customer Experience (CX) & Infrastructure SQL
These SQL queries demonstrate how analytics teams query route telemetry and survey scores to extract human-centered mobility insights.
Query 1: Identifying Low-Stress “Human Optimal” Routes vs. High-Friction Fast Routes
CX Context: Flags alternative routes that add minor travel time (+1 to +6 min) but deliver a significant drop in driver stress (≥ 3 points lower).
-- Compare routes within the same destination to highlight low-friction alternativesWITH RouteStats AS ( SELECT Destination, Route_Name, Time_Min, Distance_Mi, Stress_Score, Confidence_Score, (Unprotected_Left + Lane_Changes + Major_Intersecti + Unclear_Signage) AS Total_Friction_Events, MIN(Time_Min) OVER (PARTITION BY Destination) AS Fastest_Time_Min, MAX(Stress_Score) OVER (PARTITION BY Destination) AS Max_Stress_In_Corridor FROM Data)SELECT Destination, Route_Name, Time_Min, (Time_Min - Fastest_Time_Min) AS Time_Penalty_Min, Stress_Score, (Max_Stress_In_Corridor - Stress_Score) AS Stress_Reduction_Points, Confidence_Score, Total_Friction_EventsFROM RouteStatsWHERE (Max_Stress_In_Corridor - Stress_Score) >= 3ORDER BY Destination, Stress_Score ASC;
Query 2: High-Risk Infrastructure Corridor Analysis (Accident & Signage Risk Audit)
CX Context: Groups routes by high-risk flags and unclear signage to evaluate how specific design hazards impact driver confidence scores.
-- Audit how specific infrastructure hazards correlate with cognitive burden metricsSELECT Notable_High_Ris, COUNT(ID) AS Route_Count, ROUND(AVG(Unclear_Signage), 2) AS Avg_Unclear_Signage, ROUND(AVG(Unprotected_Left), 2) AS Avg_Unprotected_Lefts, ROUND(AVG(Stress_Score), 2) AS Avg_Stress_Score, ROUND(AVG(Confidence_Score), 2) AS Avg_Confidence_ScoreFROM DataWHERE Notable_High_Ris IS NOT NULLGROUP BY Notable_High_RisORDER BY Avg_Stress_Score DESC;

Query 3: Multi-Factor Friction Index & Route Optimization Rating
CX Context: Computes a custom Composite Friction Index to rank routes from “Human-Optimal” (safe, low friction) to “High Cognitive Load” (stressful).
-- Create a custom human-centered composite friction score and categorizationSELECT ID, Origin, Destination, Route_Name, Time_Min, Stress_Score, Confidence_Score, -- Custom composite friction metric calculation ( (Unprotected_Left * 2.5) + (Unclear_Signage * 2.0) + (Major_Intersecti * 1.5) + Lane_Changes ) AS Composite_Friction_Index, CASE WHEN Stress_Score <= 3 THEN 'Human Optimal (Low Strain)' WHEN Stress_Score BETWEEN 4 AND 6 THEN 'Moderate Effort / Acceptable' ELSE 'High Cognitive Load (Avoid/Caution)' END AS Route_Recommendation_TierFROM DataORDER BY Composite_Friction_Index DESC;
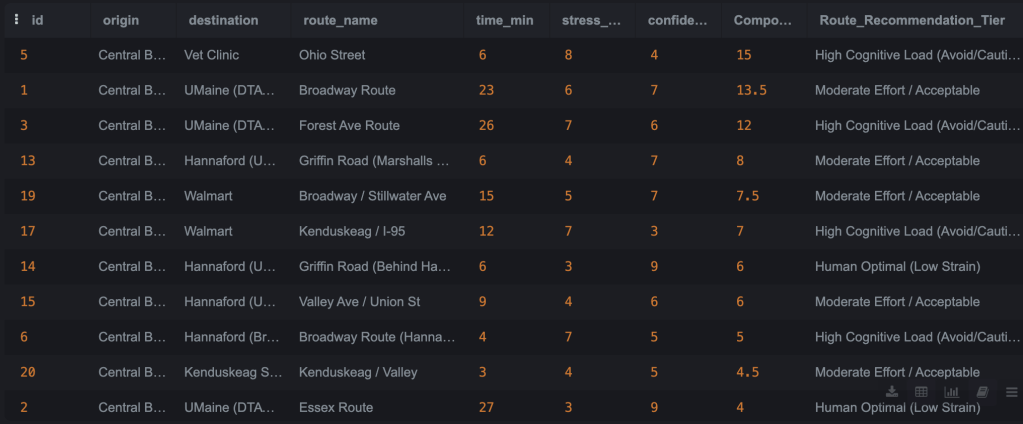
Tableau Story
Standard algorithms optimize purely for minimal time/distance, while high cognitive strain routes (like Ohio St) add significant mental friction for cautious or returning drivers.
This story concludes with human-optimal route recommendations and actionable corridor choices, demonstrating how adding 1–5 minutes of travel time can reduce driving stress by up to 60% while maintaining driver confidence.