Customer Experience & Behavioral Analysis
Why This Project
To transition successfully into junior customer experience (CX) analytics, I wanted to move beyond traditional qualitative content strategy and demonstrate the ability to translate real-world human behavior into structured data models.
I treated personal hiking logs as a product dataset, where:
- trails represent “services”
- physical specs represent “feature costs”
- friction points represent “usability pain points,” and
- repeat intent represents “customer retention/loyalty”
This project showcases how to diagnose churn drivers and identify high-value service delighters using SQL and Tableau.
Dataset
I created and structured this dataset manually, logging 28 distinct hikes across Maine.
Each record captures:
- spatial coordinates (Latitude, Longitude)
- physical attributes (Distance, Elevation Gain, Terrain Type)
- qualitative behavioral metrics (View Score, Primary Friction Type, User Sentiment, Repeat Intent)
Core Takeaways
1. Friction vs. Retention (Repeat Intent)
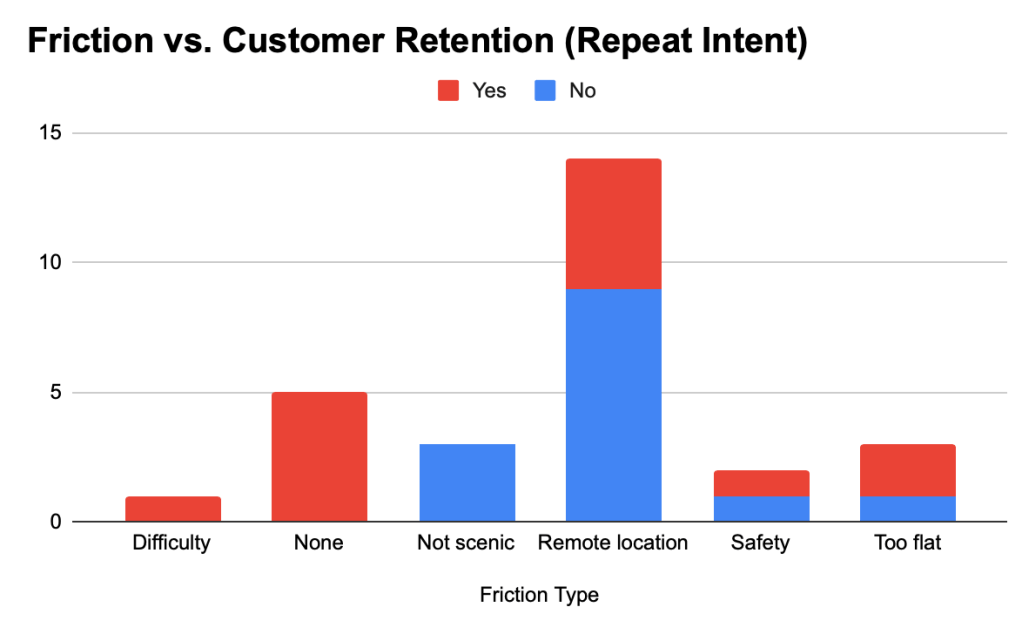
Analyzing operational friction against customer retention reveals clear churn drivers.
As shown below, while environmental frictions like “Remote Location” or “Not scenic” heavily impact repeat intent, the user is willing to tolerate remote travel if the scenic reward is high.
Conversely, safety issues instantly tank customer satisfaction.
2. Behavioral Segmentation & Pain Point Analysis
Using targeted SQL queries with AI assistance, I extracted behavioral segments to mimic querying a live user feedback database.
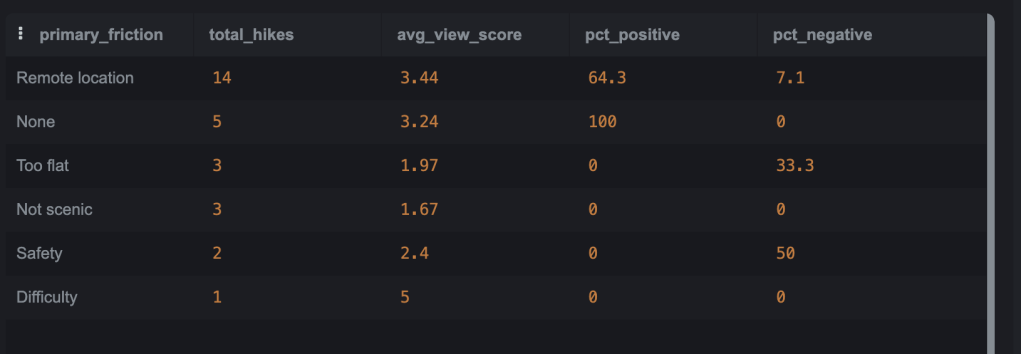
Query 1: Friction Impact on Sentiment & Retention
Business Logic: Grouping by friction type to evaluate volume, average view score, and sentiment percentages.
Finding: “Remote Location” hikes are highly tolerable (only 7.1% negative sentiment), whereas “Safety” friction triggers severe dissatisfaction (50% negative sentiment).
SELECTPrimary_Friction_Type,COUNT(Hike_ID) AS total_hikes,ROUND(AVG(View_Score), 2) AS avg_view_score,ROUND(SUM(CASE WHEN User_Sentiment = 'Positive' THEN 1 ELSE 0 END) * 100.0 / COUNT(), 1) AS pct_positive,ROUND(SUM(CASE WHEN User_Sentiment = 'Negative' THEN 1 ELSE 0 END) * 100.0 / COUNT(), 1) AS pct_negativeFROM Hiking_DataWHERE Primary_Friction_Type IS NOT NULLGROUP BY Primary_Friction_TypeORDER BY total_hikes DESC;
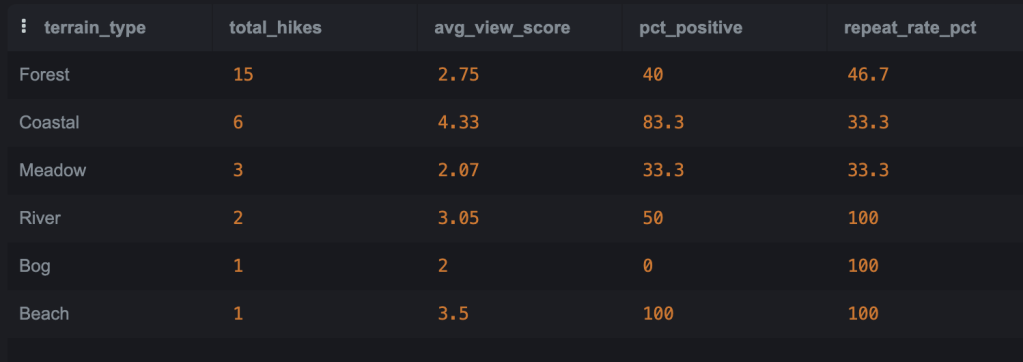
Query 2: Terrain-Based Usability Analysis
Business Logic: Evaluating environment preference profiling across different terrain types.
Finding: Coastal trails yield the highest aesthetic ratings (4.33 avg view score), while River and Beach terrains show 100% repeat intent in this sample.
SELECTTerrain_Type,COUNT(Hike_ID) AS total_hikes,ROUND(AVG(View_Score), 2) AS avg_view_score,ROUND(SUM(CASE WHEN User_Sentiment = 'Positive' THEN 1 ELSE 0 END) * 100.0 / COUNT(), 1) AS pct_positive,ROUND(SUM(CASE WHEN Repeat_Intent = 'Yes' THEN 1 ELSE 0 END) * 100.0 / COUNT(), 1) AS repeat_rate_pctFROM Hiking_DataGROUP BY Terrain_TypeORDER BY total_hikes DESC;
Query 3: Effort-to-Reward Efficiency (“High-Efficiency Delighters”)
Business Logic: Filtering for low physical effort (distance ≤ 2 miles or elevation gain ≤ 250 feet) paired with high aesthetic yield (View Score ≥ 4).
Finding: Pinpoints high-yield sweet spots like Klondike Mountain and Sipp Bay Preserve, which maximize customer value with minimal friction.
SELECT Trail_Name, Distance_miles, Elevation_Gain, View_Score, Primary_Friction, User_Sentiment, Repeat_IntentFROM Hiking_DataWHERE View_Score >= 4 AND (Distance_miles <= 2.0 OR Elevation_Gain <= 250)ORDER BY View_Score DESC, Distance_miles ASC;

Tableau Dashboard
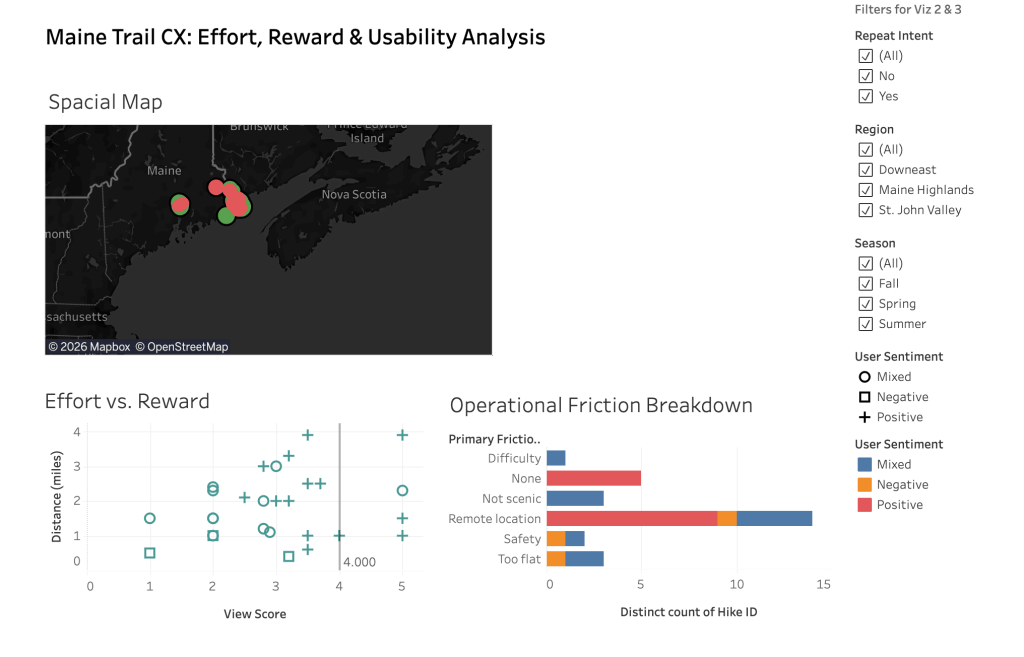
To tie spatial distribution and behavioral metrics together, I built an interactive Tableau dashboard featuring:
Spatial CX Map: Placed via latitude/longitude, color-coded by Repeat_Intent and sized by View Score to visualize regional clustering.
Effort vs. Reward Scatter Plot: Highlighting efficiency outliers and delighter clusters.
Operational Friction Breakdown Bar Chart: Quantifying top user pain points across difficulty tiers.