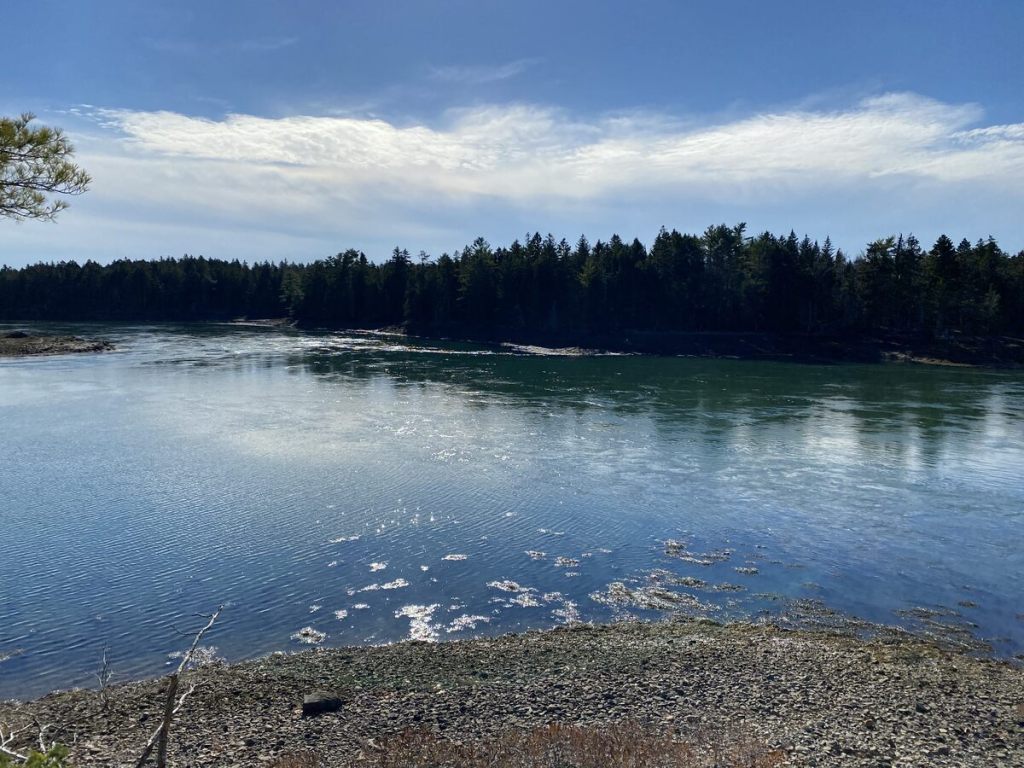
October 2025 – Present
This page highlights my Maine‑based visual work of photography and sketches.
They reflect my real-world data journey through hiking and driving, which include:
- elevation changes
- route decisions
- weather variables
- photo metadata (time, GPS, light)
These practices sharpen the same observational and analytical skills I bring to BI work:
- noticing details
- mapping terrain
- interpreting patterns over time
This data will also form the basis of a Tableau project I’d like to work on to explore Maine hiking 🌲
Featured in:
- My Maine This Week
- Maine Trail Finder — reviews + photos
🏞️ Maine Photography
Downeast Maine has many trails and nature spots featuring rugged beauty.
A. Seasonal Changes
I grew up in a place without snow or the four seasons, so the seasonal changes are endlessly fascinating.
When possible, I return to the same spot in different seasons to document the landscape.

B. Coastal Textures
I hiked quite a few spots in Downeast Maine, where mood, light, and shadow were always part of the region’s rocky coastline.
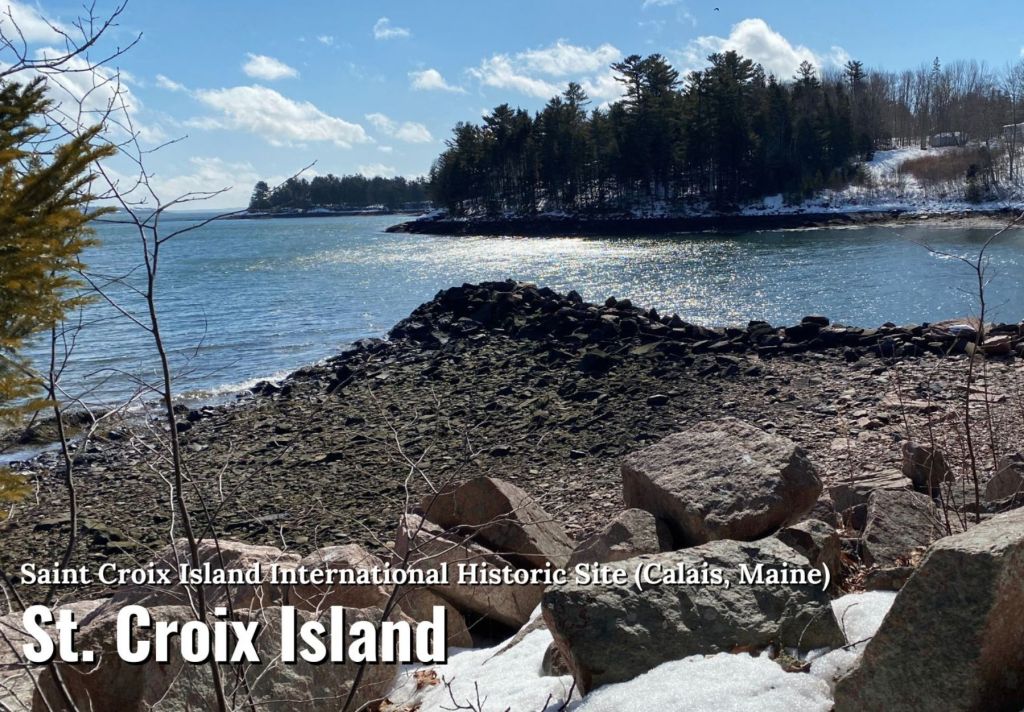

C. Colors
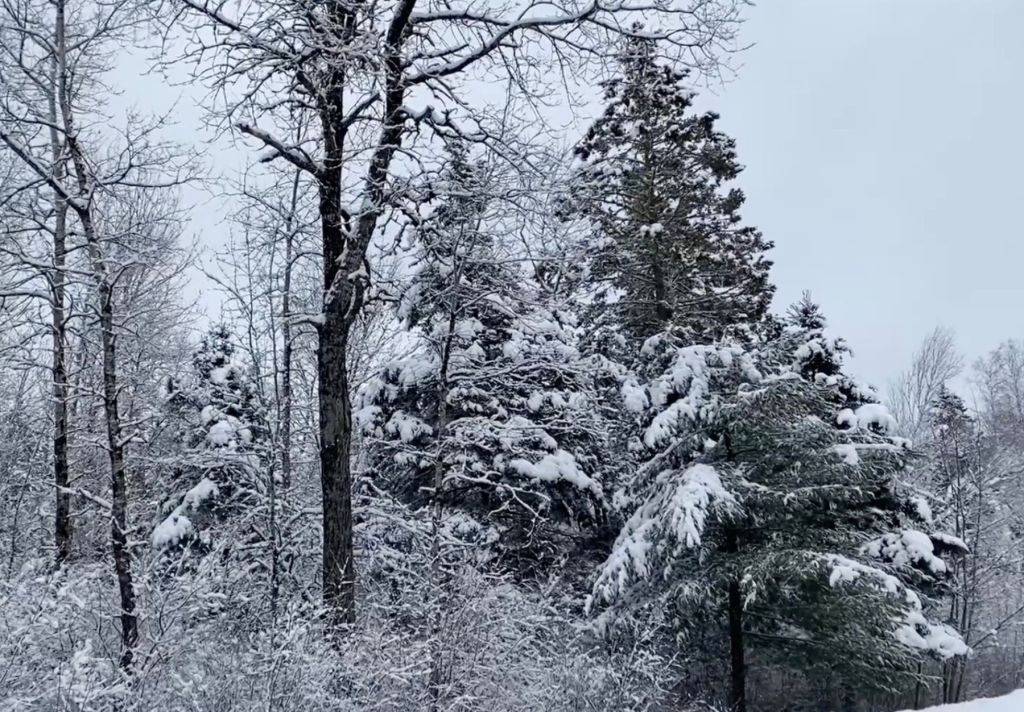
Whether it’s the calm, blue waters of a bay, or the stark contrast of bare trees against a gray winter sky, colors are a core component of these nature wanderings.

✏️ Maine Landscape Sketches
Sketching helps me:
- slow down
- observe structure
- translate complex scenes into essential forms
These are skills that I apply to data modeling and dashboard design.
View more sketches on Watercolor Notes (via Urban Sketchers).

🧭 Navigation + Structure
Hiking and navigating Maine’s landscapes strengthens my pattern recognition, situational awareness, and resilience.
The visual practices of photography and sketching complement my analytical work by training my eye for:
- structure
- clarity
- meaningful patterns

